Search Colleges, Exams, Schools & more


Login
Electrocardiogram (ECG) MCQ - Practice Questions with Answers
Edited By admin | Updated on Sep 18, 2023 18:34 AM | #NEET
Quick Facts
-

ECG is considered one of the most asked concept.
-

23 Questions around this concept.
Solve by difficulty
 EASY
EASYThe T wave in ECG represents
Examine the diagrammatic representation of standard ECG. Select an option with correct matching.

The diagram given here is the standard ECG of a normal person. The P - wave represents the:
In a standard ECG which one of following alphabets is the correct representation of the respective activity of the human heart?
Concepts Covered - 1
ECG
ECG
- The representation of the electric current produced by the excitation of the cardiac muscles in the form of a graph is called an electrocardiogram (ECG)
- The machine by which the electrocardiogram is recorded is called as electrocardiograph.
- Electrocardiograph was invented by Einthoven and he is known as the father of electrocardiography
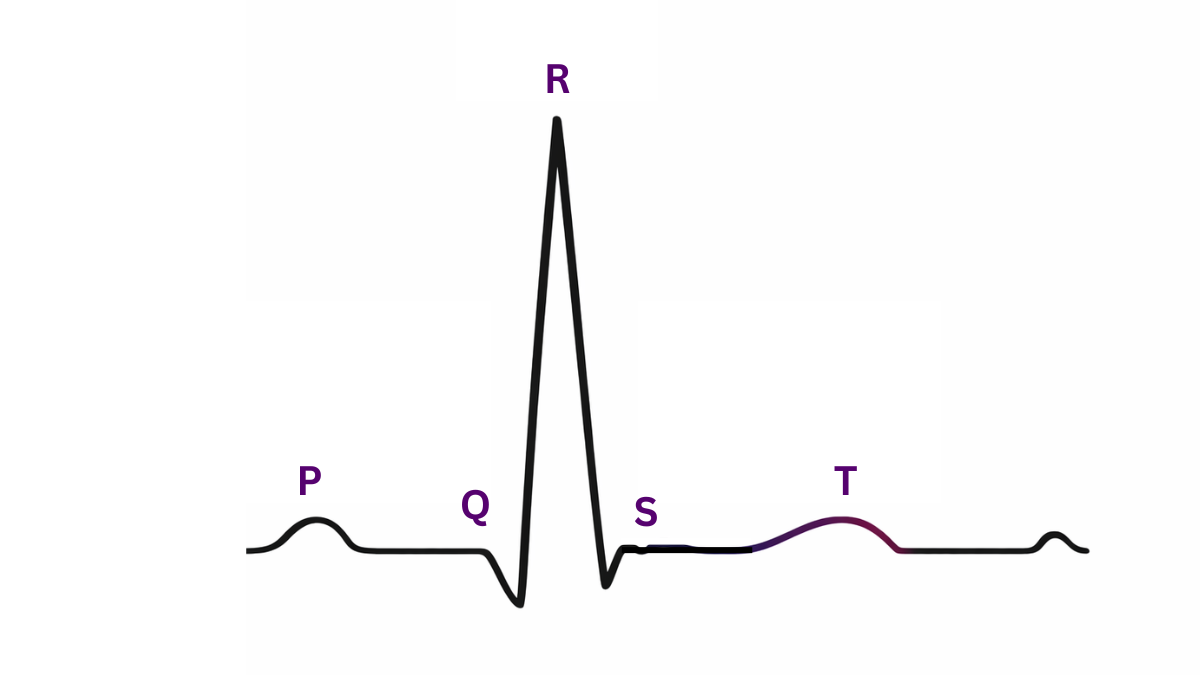
- An electrocardiogram shows three consecutive waves namely P wave, QRS wave and the T wave.
1. P wave-
- It is a small upward wave that indicates the depolarisation of the atria leading to contraction of both atria. It is caused by the activation of SA node
2. QRS wave
- It begins after a fraction of a second of the P wave
- It begins as a small downward deflection (Q) and continues as large upright (R) and triangular wave, ending as downward wave (S) at its base
- QRS wave indicates depolarization of ventricles
- It is caused by the impulses of the contraction from AV node through the Bundle of His and Purkinje fibres and the contraction of ventricular muscles
- In this wave there is a spread of electrical impulses through ventricles
- The normal duration of the QRS complex is <0.10 seconds
3. T wave
- The T wave is dome-shaped and it indicates ventricular repolarization ( ventricular relaxation)
- The end of T waves marks systole

P-R interval
- It is the time required for an impulse to travel through the atria and AV node to the remaining conductive tissue.
- The normal duration of P-R interval is <0.12 to 0.2 seconds
- The P-R interval is lengthened during conditions like arterosclerotic heart disease and rheumatic fever due to the inflammation of atria and AV node
S-T interval
- It is the time between the end of the spread of impulse through ventricles and its repolarization.
- It starts at the end of the S wave and terminates at the beginning of the T wave
- During acute myocardial infarction S-T segment is elevated while it is depressed during the insufficient supply of oxygen to the muscles
Q-T interval
- The QT interval represents the time of ventricular activity including both depolarization and repolarization.
- It is measured from the beginning of the QRS complex to the end of the T wave.
- The QT interval will vary with patient gender, age and heart rate.
- The normal duration of Q-T interval is <0.42 seconds

Study it with Videos
"Stay in the loop. Receive exam news, study resources, and expert advice!"